Equity markets
Losses continued in the equity markets for third week in a row. S&P lost little over 100 points for a 2.7% loss. Mixed signals from the inflation data lead the losses on the indices.
Index Pre. Close Week Open High Low Close Weekly Return S&P 500 4,079 202308 4,052 4,052 3,943 3,970 -2.71% Nasdaq 11,787 202308 11,640 11,684 11,334 11,395 -3.39% Dow Jones 33,827 202308 33,700 33,700 32,643 32,817 -3.03% Russell 1,946 202308 1,937 1,937 1,876 1,890 -2.91% VIX 20 202308 22 24 21 22 7.92%
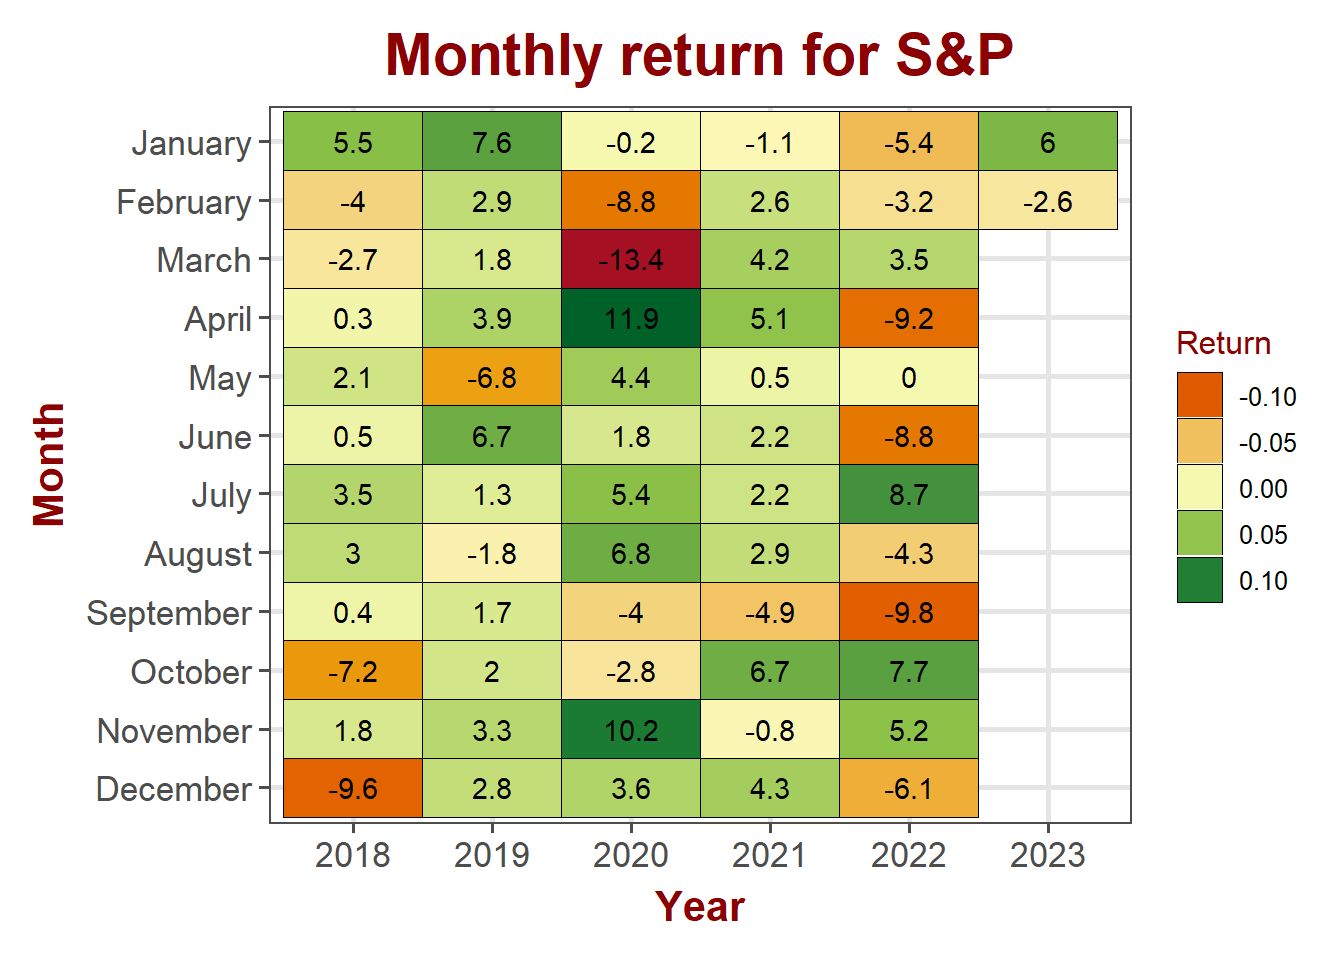
S&P 500
S&P 500 lost ~2.7%, still appears to consolidate above the 200 day moving average. Bulls so far managed to hold support but the next week could be critical for the direction going forward.
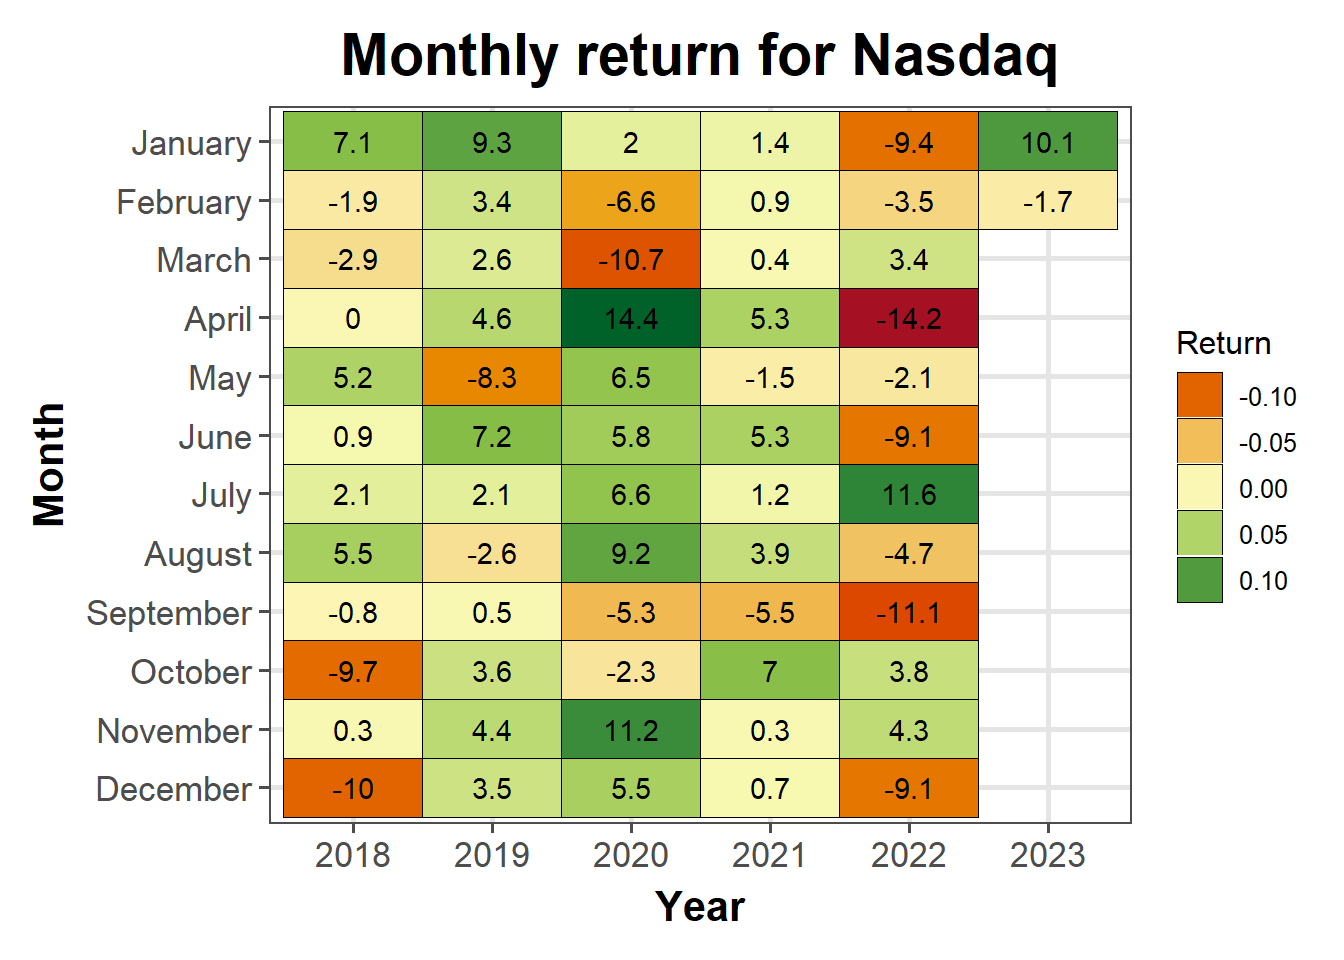
NASDAQ
Technology stocks lost ~3.4% for the week for a month to date loss of 1.7%
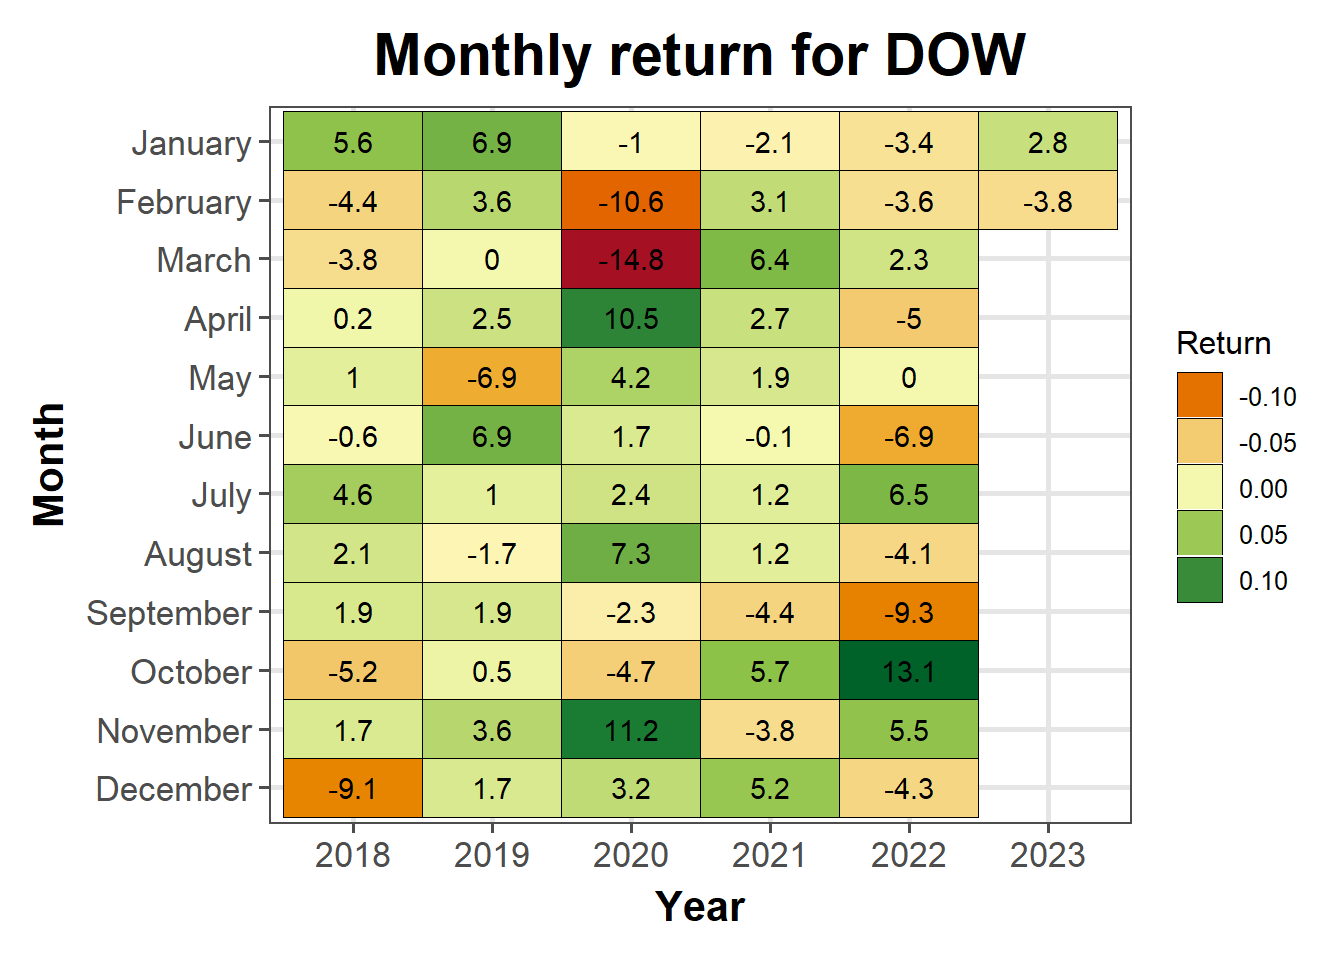
DOW Jones
DOW drifted from staying flat and lost ~3%. It lost 3.8% month to date
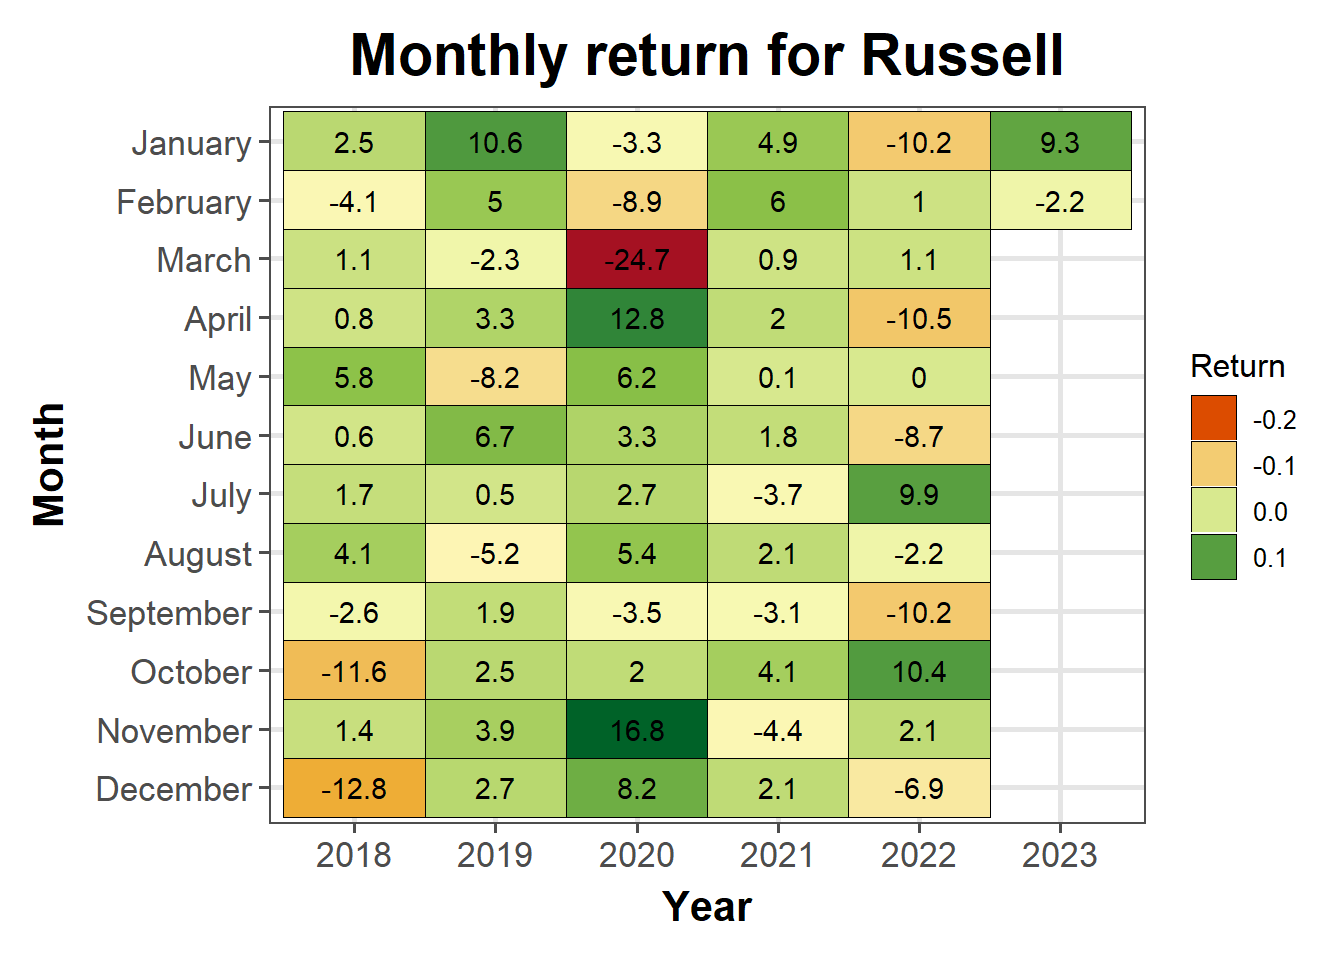
Russell
Small cap stocks lost ~2.9% for the week
Bond markets
## [1] "DGS3MO" "DGS6MO" "DFF"    "DGS1"   "DGS2"   "DGS5"   "DGS7"   "DGS10"
## [9] "DGS30"
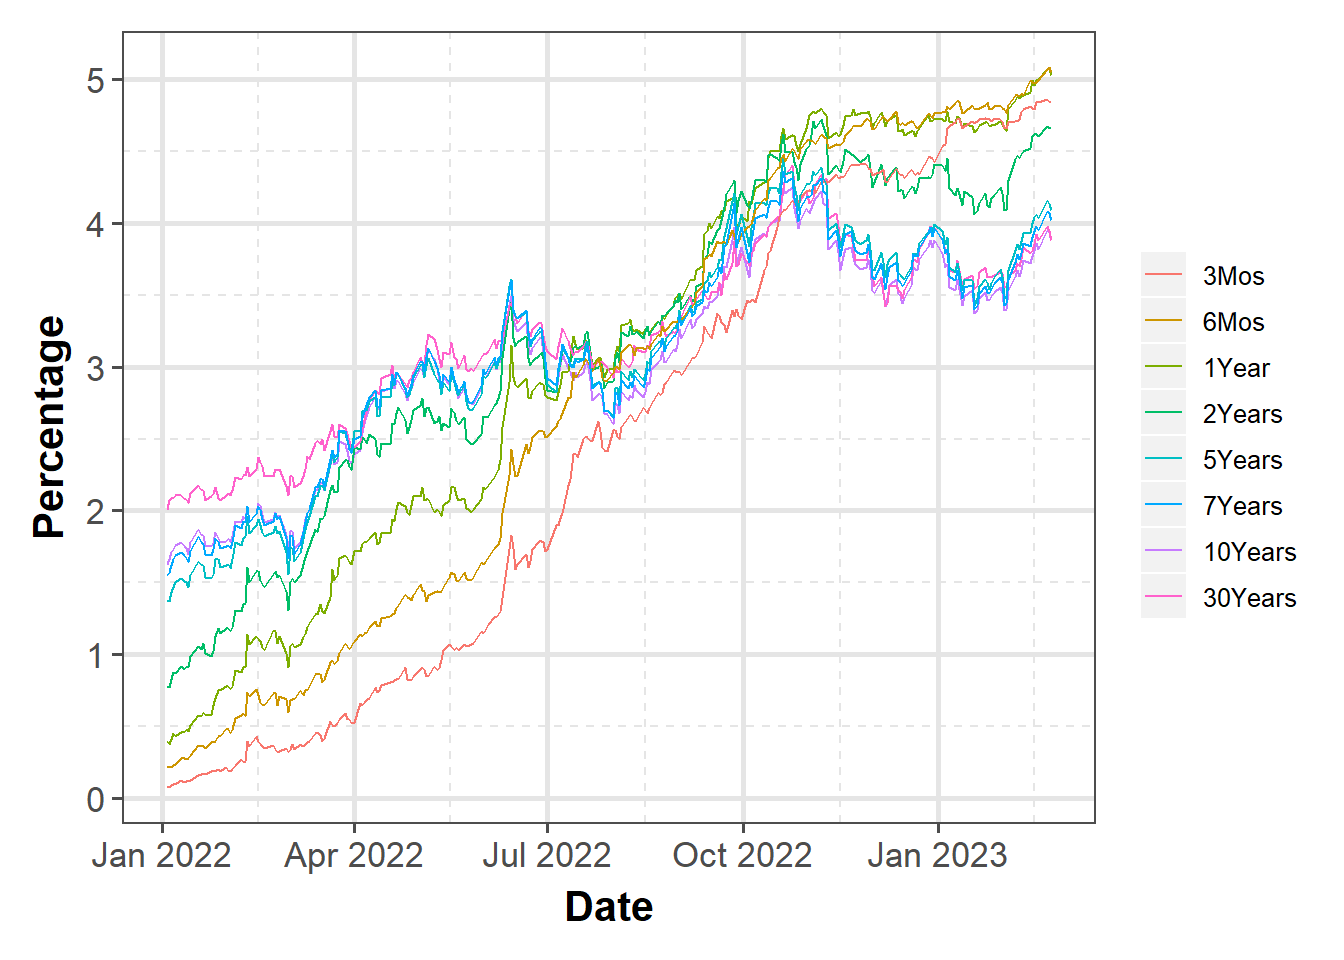
Interest rates
Treasury yields starting to inch up for the year across the yield curve
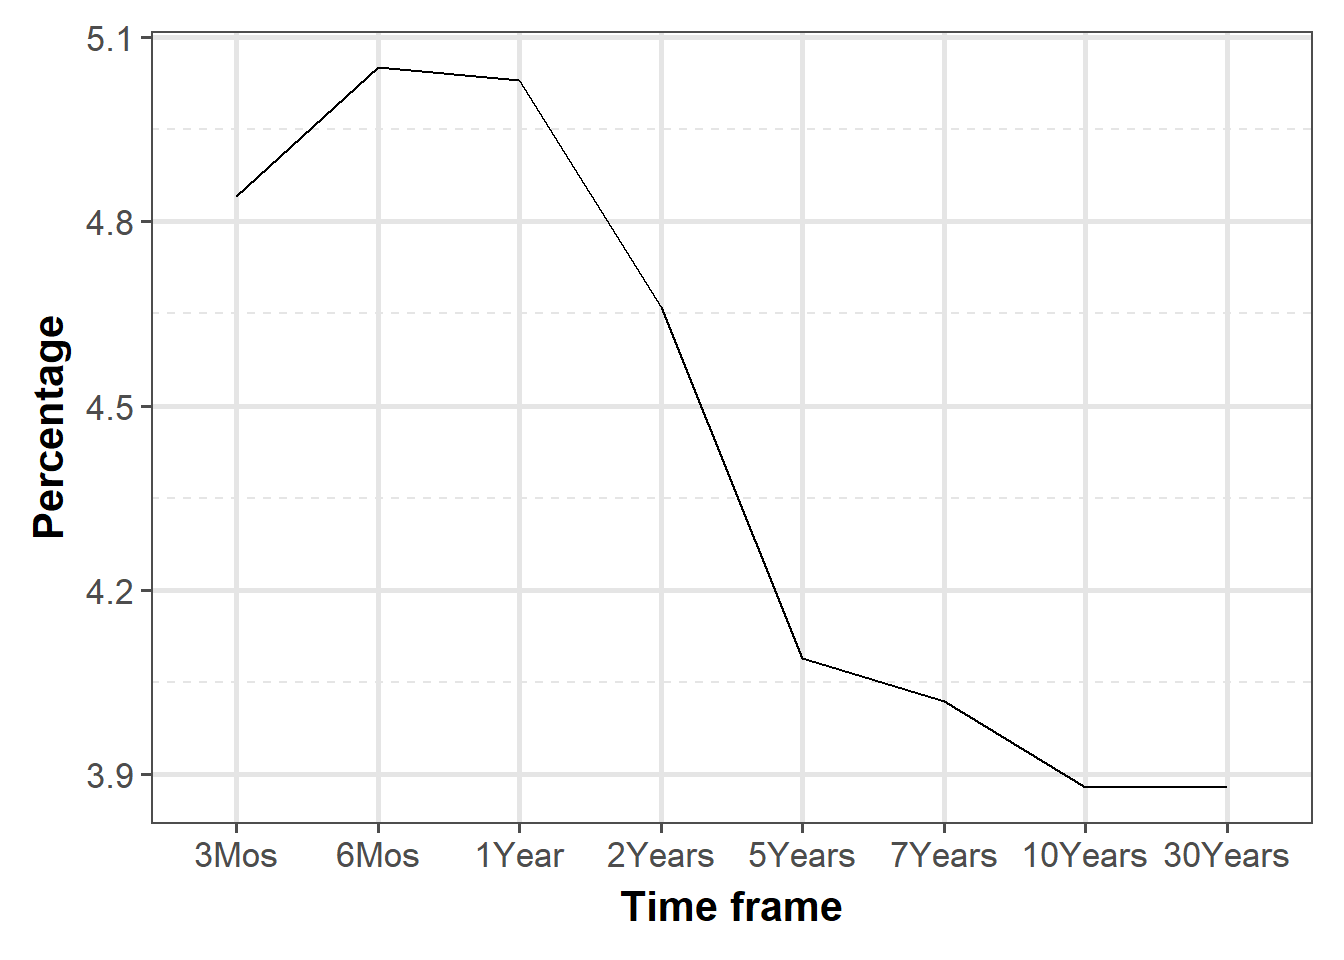
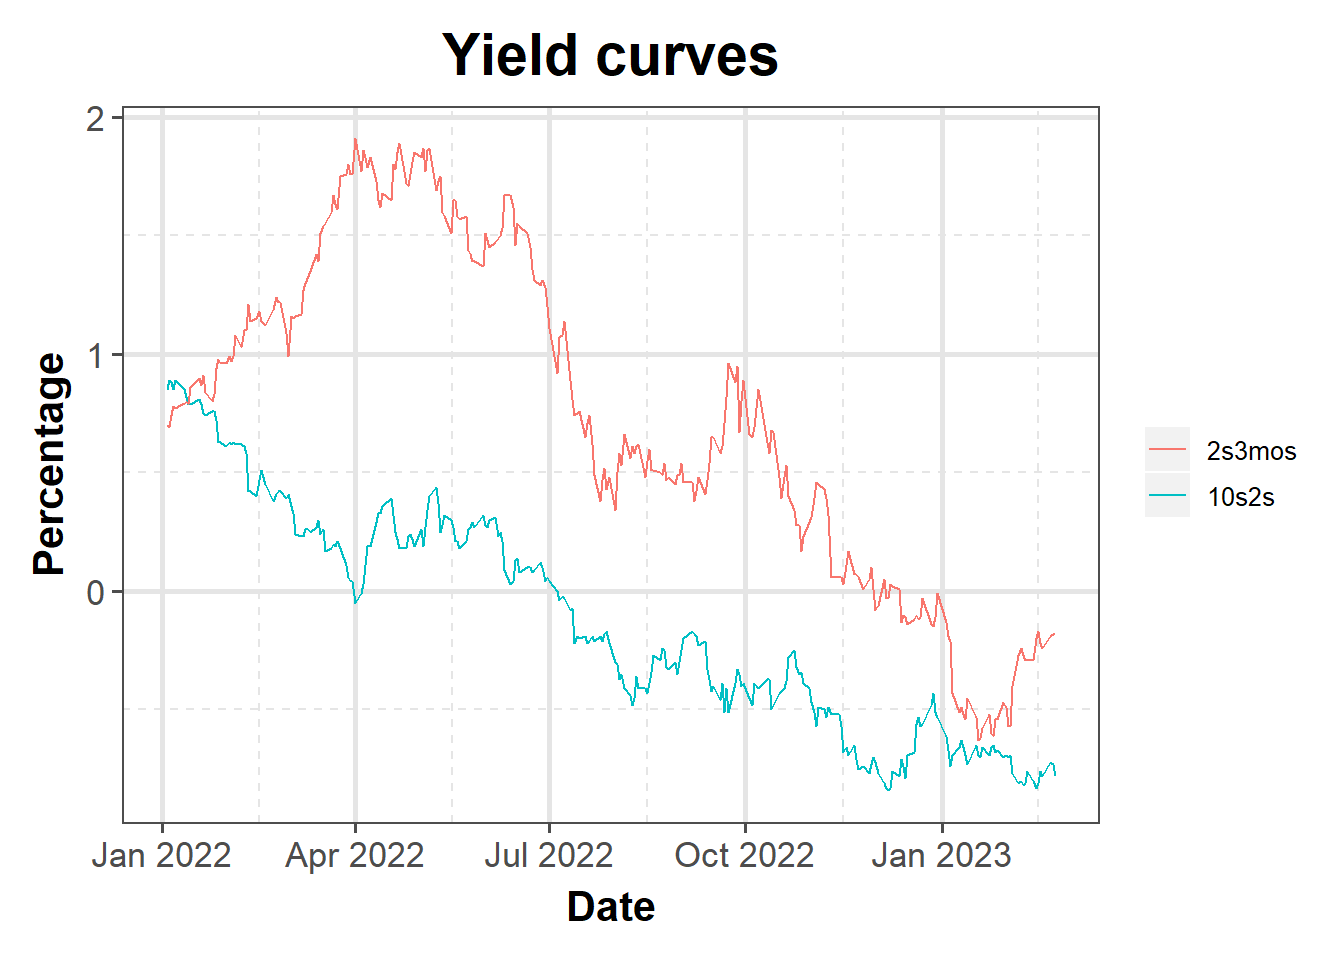
Yeild Curve
Yield curve continues to slope negatively (inverted). At the higher end, it appears that it is starting to flatten but at the lower end, it still slopes significantly negative
Disclaimer
Anything on this blog is not an investment advice. It is essential that you fully understand the risks involved before making any investment decisions. You should consult with a financial professional to help you assess your risk tolerance and to determine an investment strategy that is suitable for your individual needs.
Please note that this disclaimer is not exhaustive and is provided for informational purposes only. Investing involves risks, and it is your responsibility to carefully consider the risks before making any investment decisions.