Equity markets
Equity markets were still consolidating last week above the 200 day moving averages. CPI day last week couldn’t provide any resolution to the markets on either side.
Index Week Open High Low Close Weekly Return S&P 500 202307 4,097 4,148 4,079 4,079 -0.28% Nasdaq 202307 11,759 12,071 11,787 11,787 0.59% Dow Jones 202307 33,887 34,246 33,697 33,827 -0.13% Russell 202307 1,920 1,961 1,940 1,946 1.43% VIX 202307 22 20 18 20 -2.52%
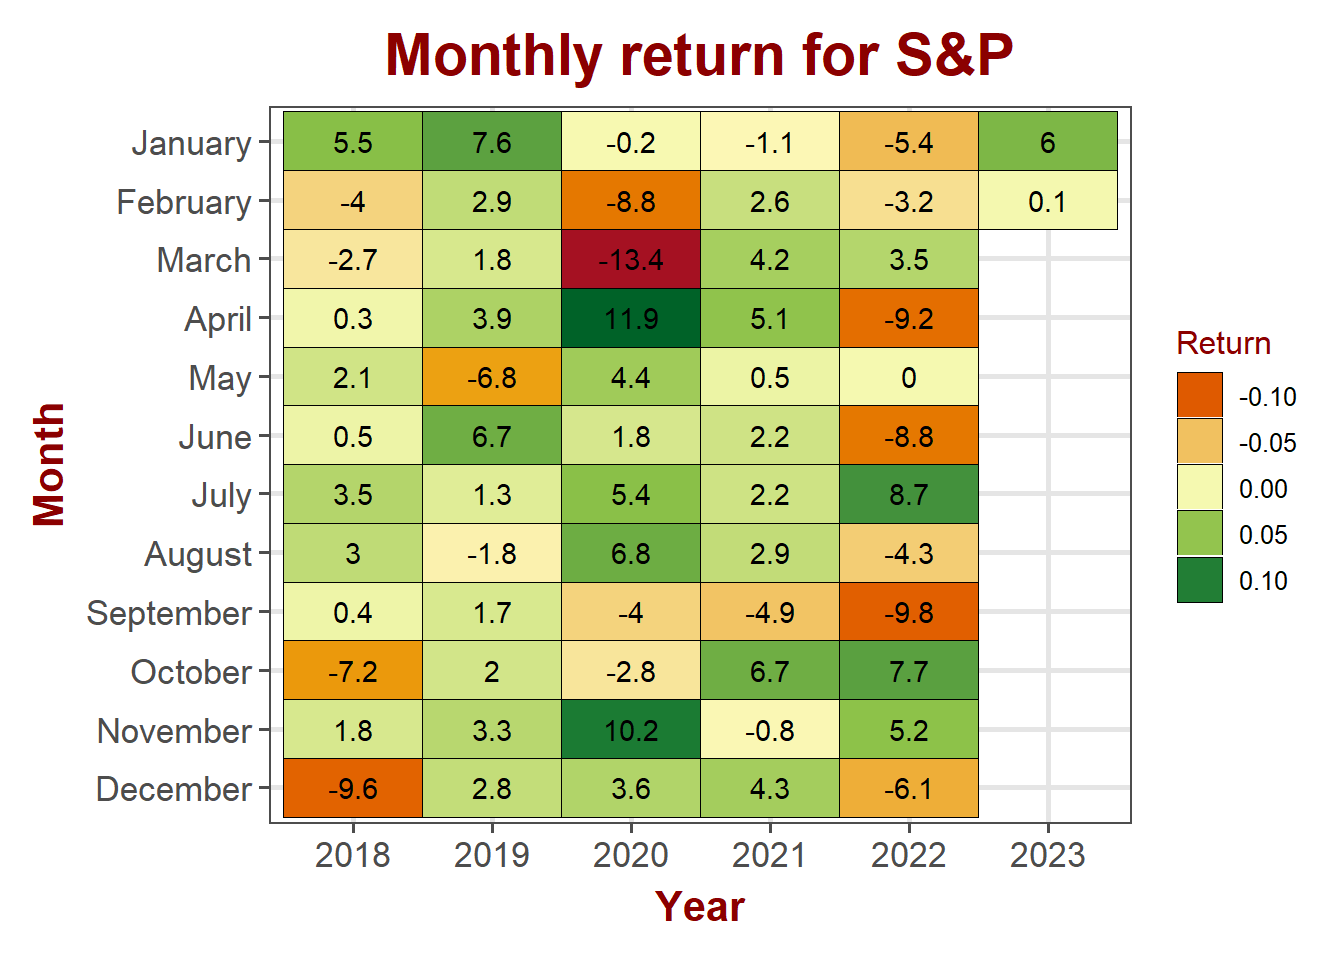
S&P 500
S&P 500 lost ~0.3%, consolidating above the 200 day moving average. Bulls so far managed to hold support and the consolidation appears like a bull flag above 200 day moving average. Technically, S&P looks like it is ready to break out in the next week or two.
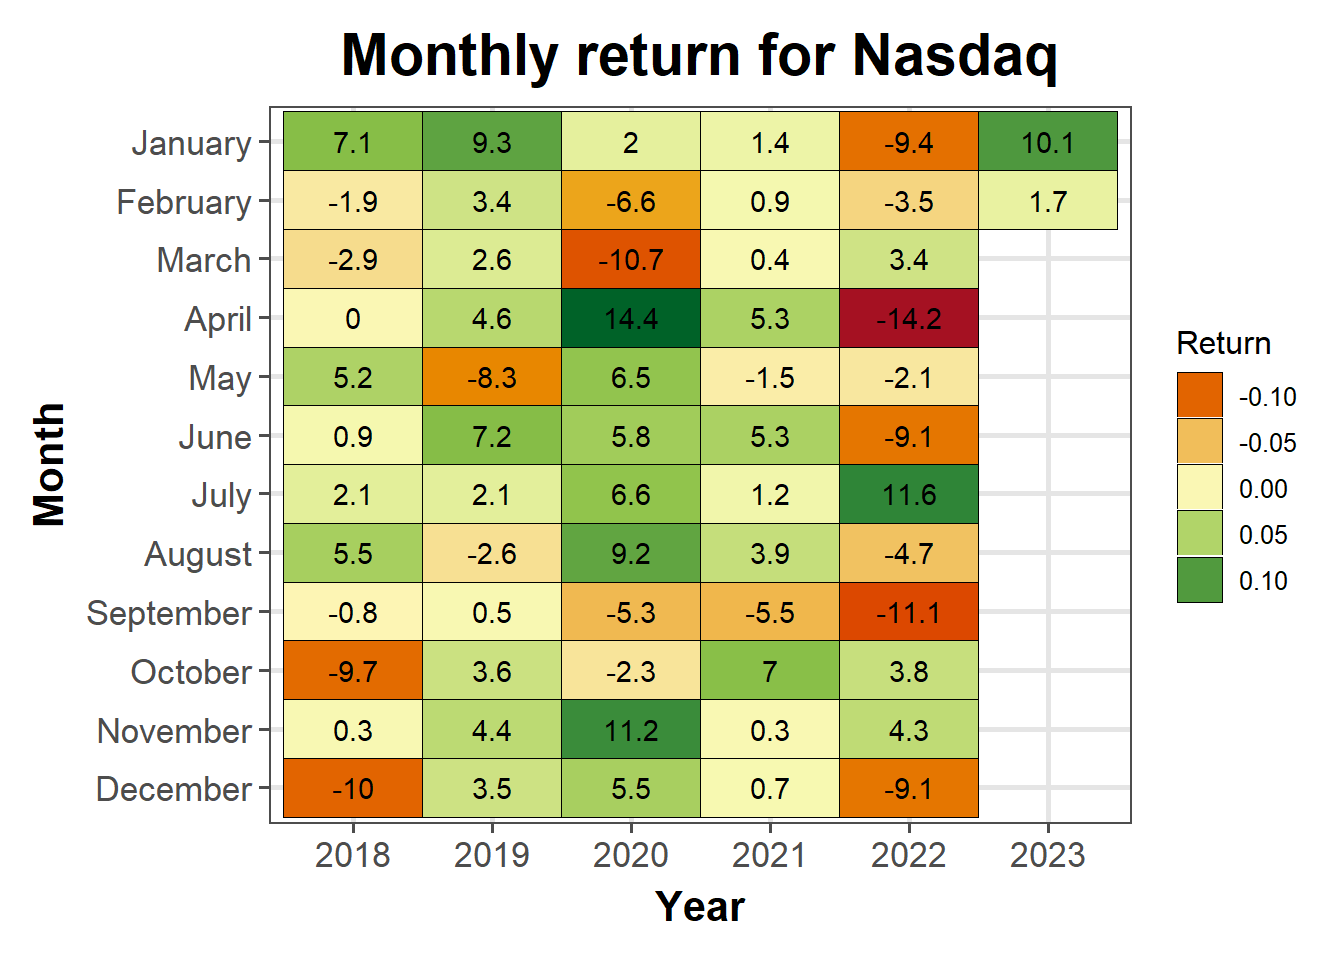
NASDAQ
Technology stocks gained ~0.6% in the week for a month to date gain of 1.7%
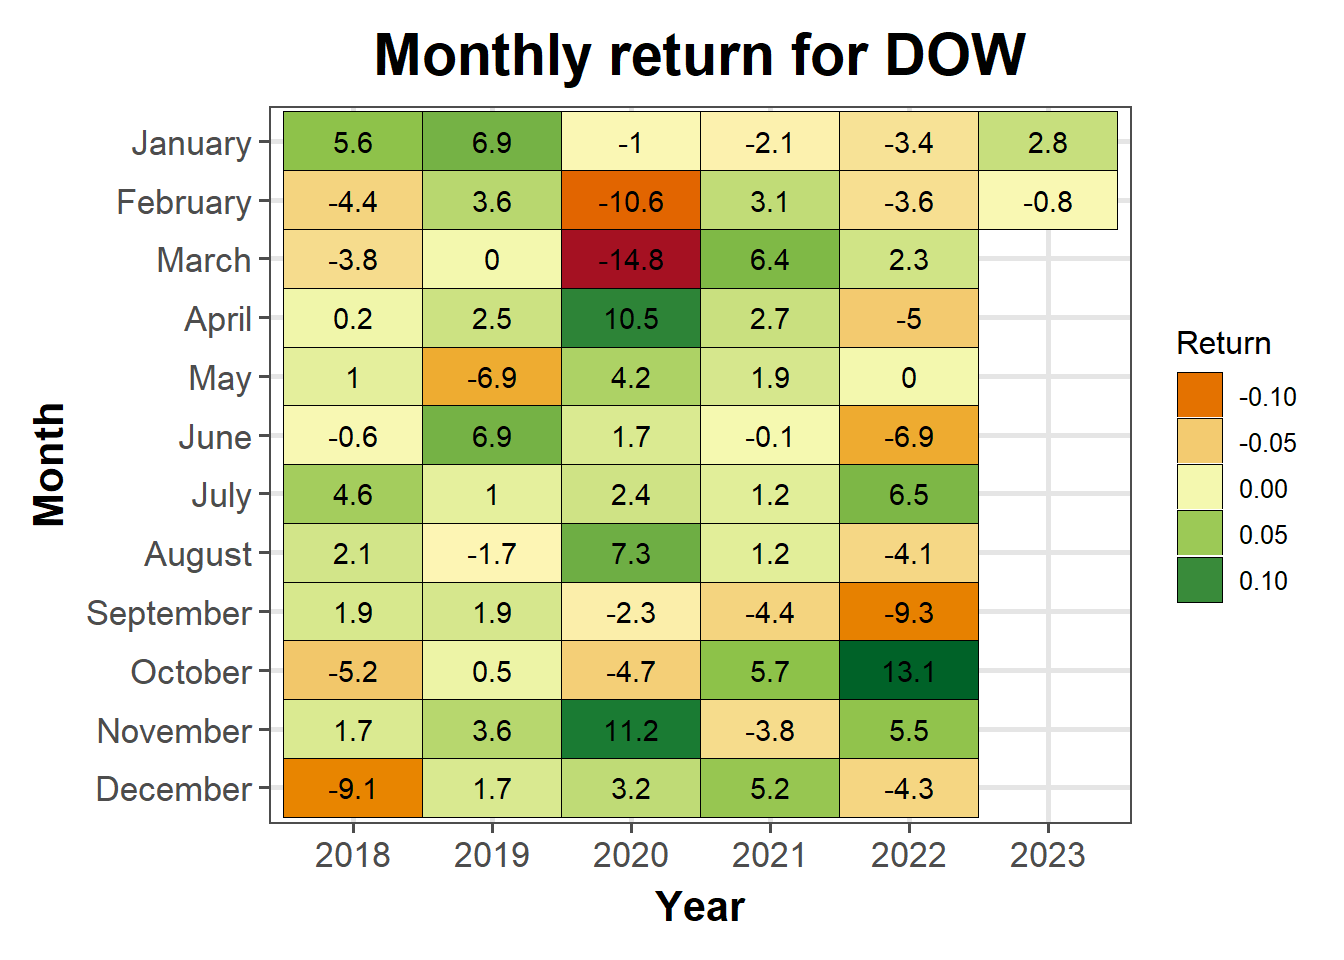
DOW Jones
DOW stayed pretty much flat with a 0.1% loss. It lost 0.8% month to date
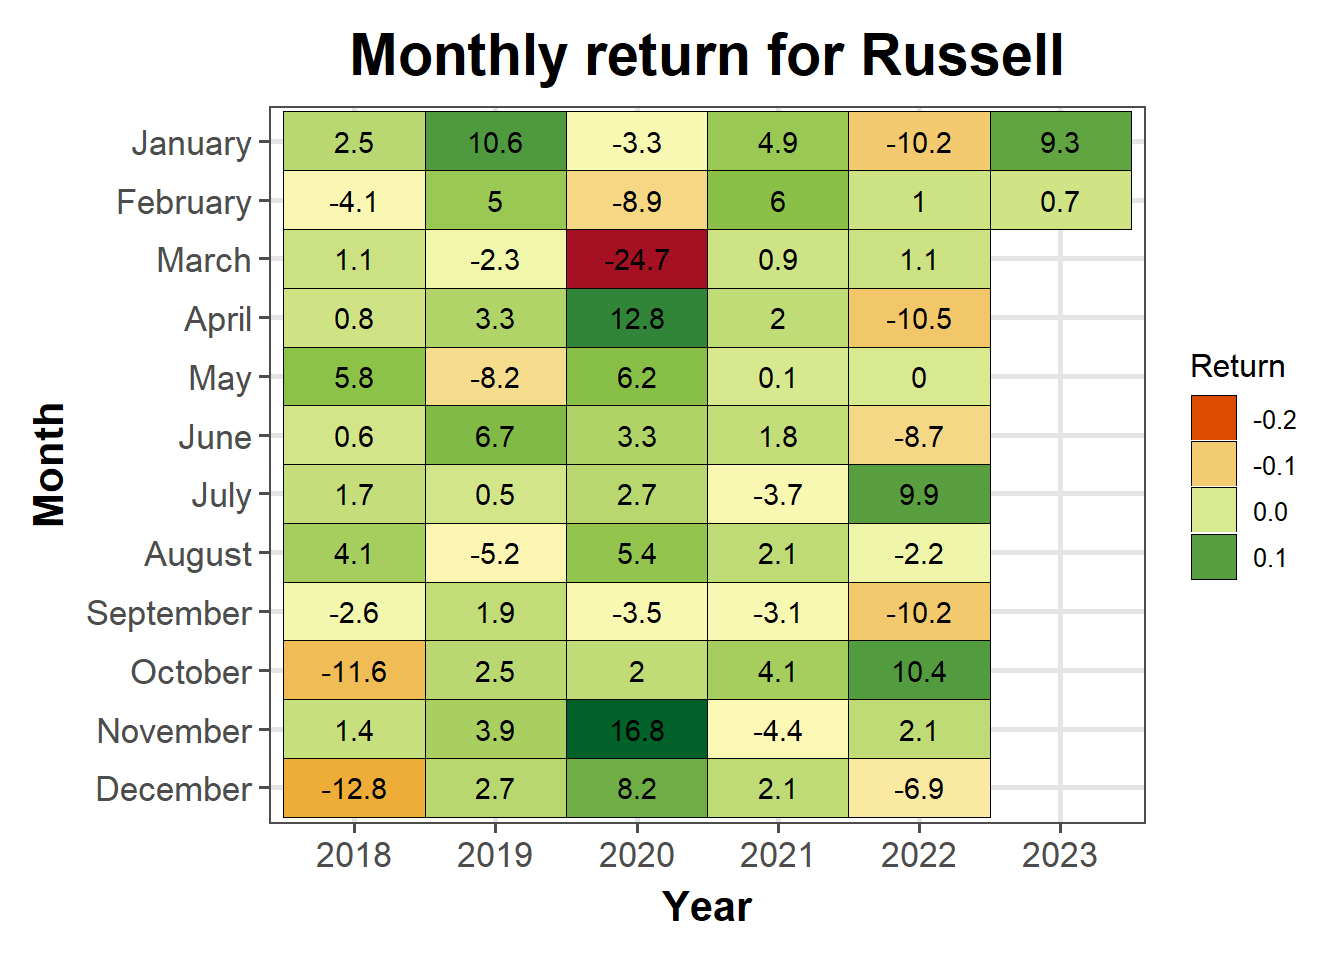
Russell
Small cap stocks gained ~1.4% for the week
Bond markets
## [1] "DGS3MO" "DGS6MO" "DFF"    "DGS1"   "DGS2"   "DGS5"   "DGS7"   "DGS10"
## [9] "DGS30"
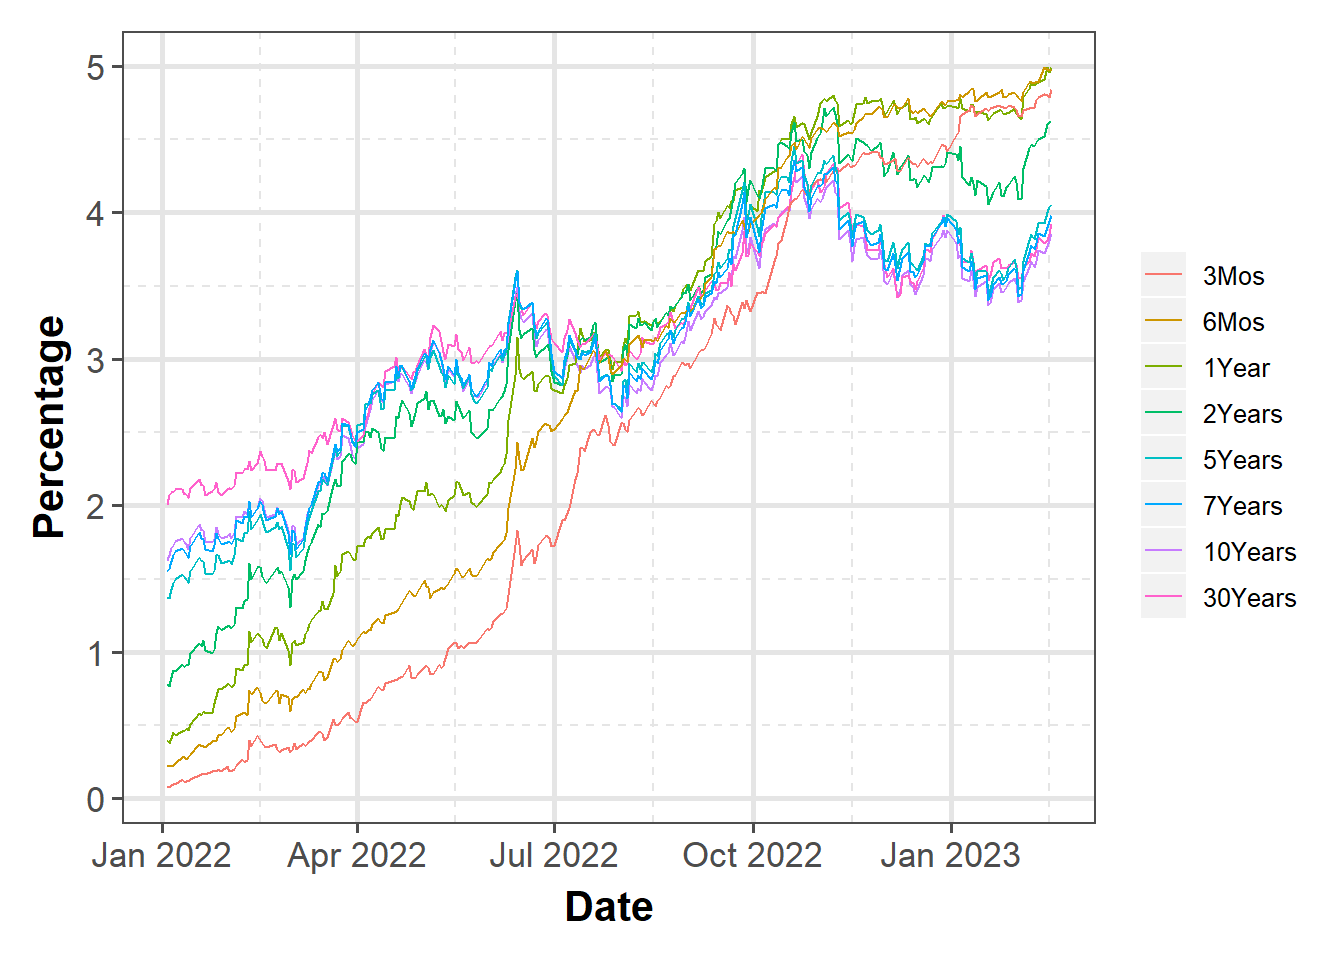
Interest rates
Longer term interest rates for treasuries are trending down while shorter term rates are staying flat to slightly down for the year.
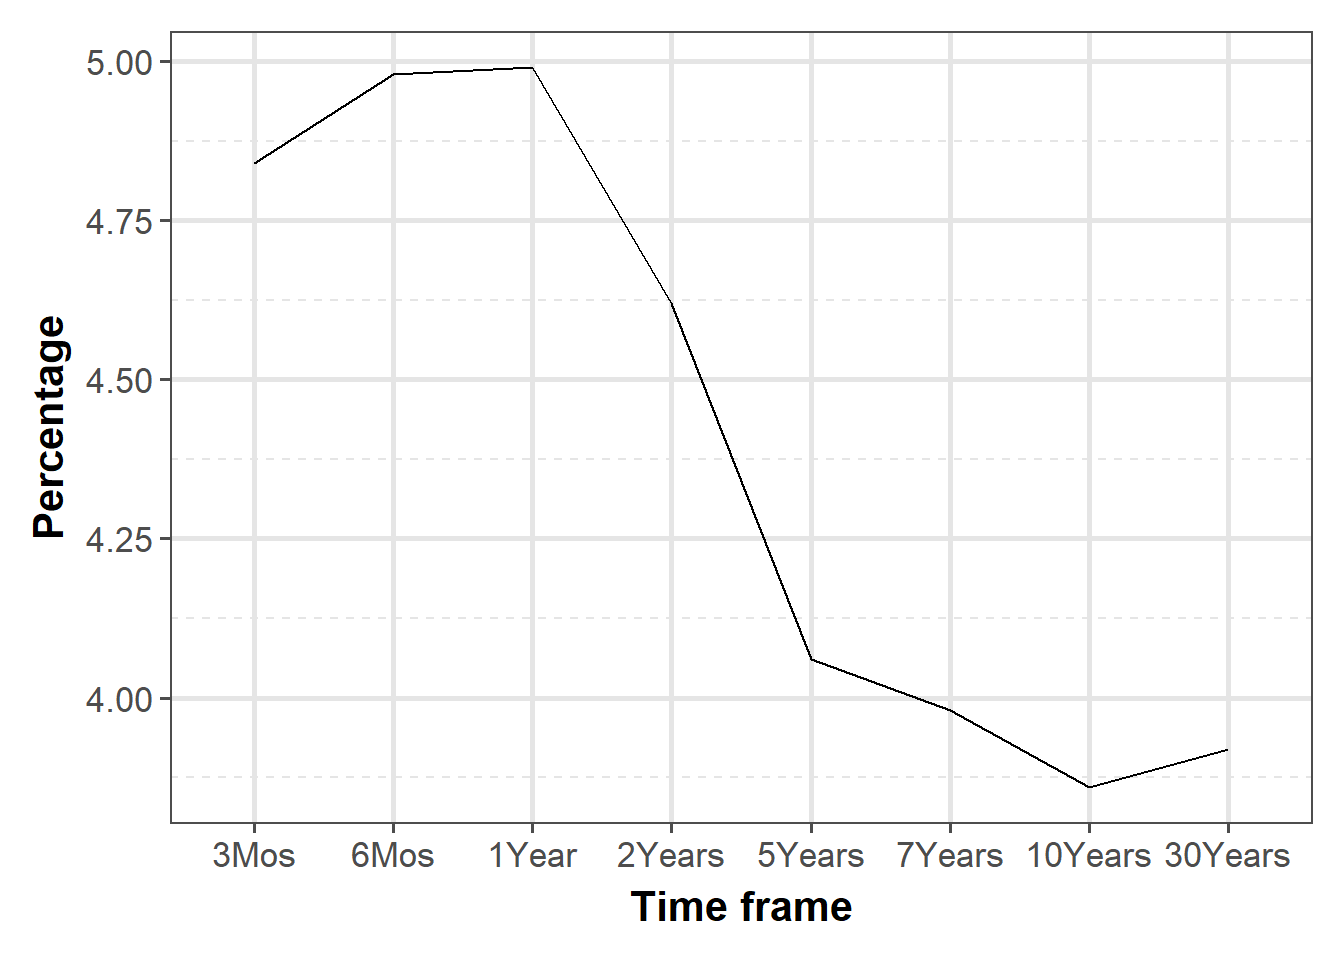
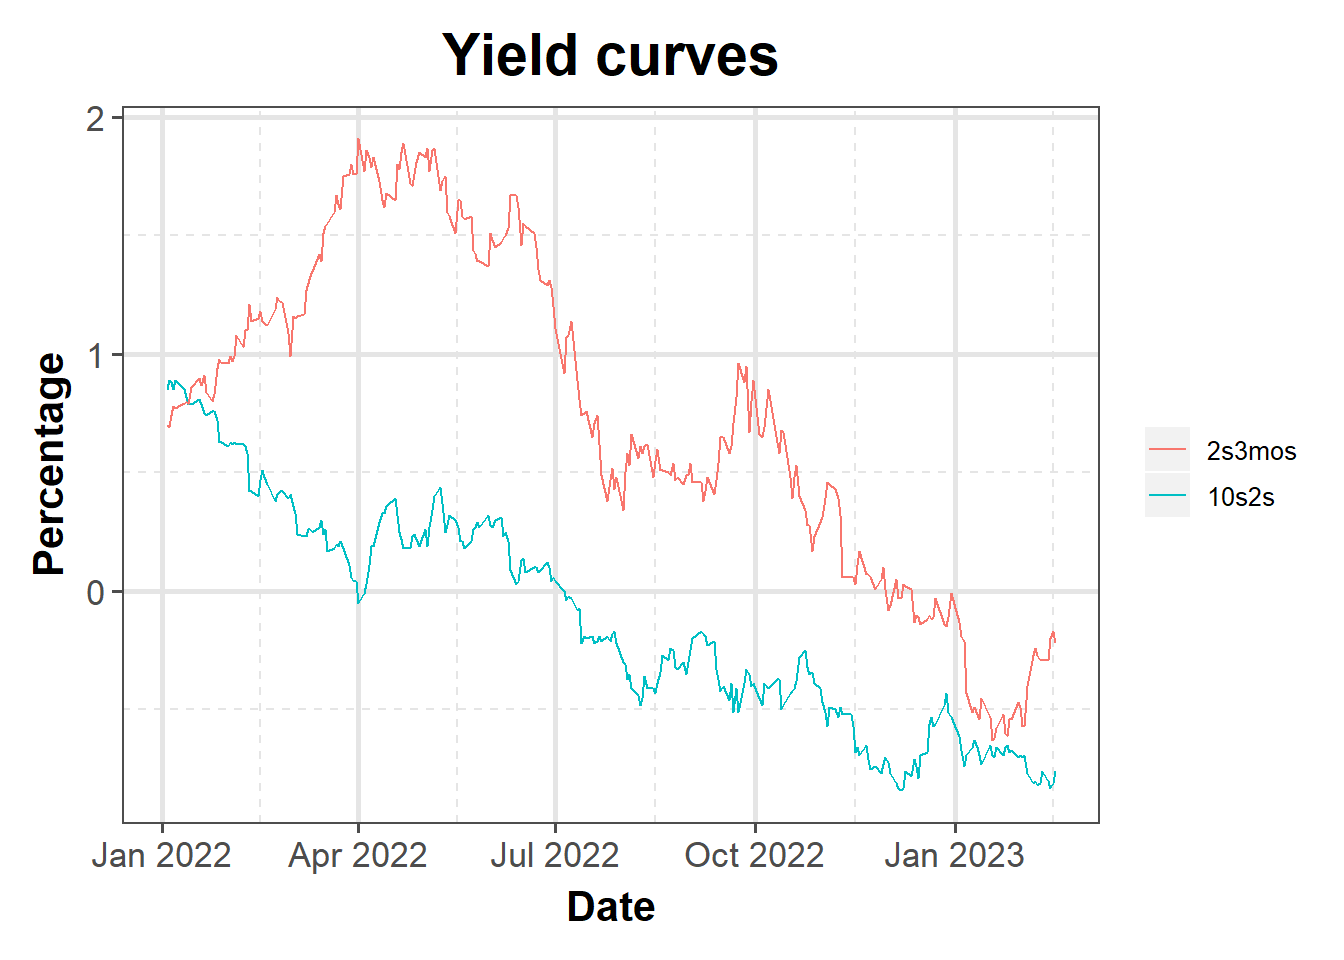
Yeild Curve
Yield curve continues to slope negatively (inverted). At the higher end, it appears that it is starting to slope positively or flat but at the lower end, it still slopes significantly negative
Disclaimer
Anything on this blog is not an investment advice. It is essential that you fully understand the risks involved before making any investment decisions. You should consult with a financial professional to help you assess your risk tolerance and to determine an investment strategy that is suitable for your individual needs.
Please note that this disclaimer is not exhaustive and is provided for informational purposes only. Investing involves risks, and it is your responsibility to carefully consider the risks before making any investment decisions.